
 📖Chuyên sâu
Reading Production: Logs, Metrics and a Calm Head
The first ten minutes of an incident, as commands rather than philosophy. Exit 137 does not mean OOM, three of four containers ignore SIGTERM entirely, both of my "healthy" containers were healthy and one was broken — and the one curl that tells you a deploy shipped a stale image before any user does.
CuongThai
30 tháng 7, 2026 · 26 phút đọc · 1226 lượt xem
The hardest part of an outage is not fixing it. It's the first ninety seconds, when you have a message saying "the site is down", a laptop, and no idea which of eleven things is actually broken. Everything you do in those ninety seconds either narrows it down or wastes the window.
So this is a guide to narrowing it down. Not monitoring philosophy — the specific commands, in the order that eliminates the most possibilities per command, with the output they actually produce. Every number below came out of a running system: a real production site measured from outside, and containers, a database and a Node process built in a lab to fail on purpose.
measured against a live site over HTTPS · docker 29.5.3 · postgres 16-alpine
node 22.21.0 · and this site's own deploy.sh, Dockerfile.backend and src/index.ts
Six of those measurements contradicted something I was about to write, including the two sentences people say most often during an incident: "it's OOM, it exited 137" and "the container is healthy so the app is fine".
First: is it down, or is it slow, and for whom?
Before reading any log, ask the outside world. One command gives you five numbers, and they are cumulative — you subtract to get each phase:
curl -s -o /dev/null -w '
  dns    %{time_namelookup}s
  tcp    %{time_connect}s
  tls    %{time_appconnect}s
  ttfb   %{time_starttransfer}s
  total  %{time_total}s
  status %{http_code}  size %{size_download}B
' https://example.com/
Against the real site, four different URLs:
| URL | dns | tcp | tls | ttfb | total | status | size |
|---|---|---|---|---|---|---|---|
/ (server-rendered) |
3 ms | 9 ms | 27 ms | 49 ms | 97 ms | 200 | 89 KB |
/api/v1/profile |
3 ms | 52 ms | 90 ms | 109 ms | 109 ms | 401 | 84 B |
a static .svg |
3 ms | 9 ms | 30 ms | 41 ms | 41 ms | 200 | 3 KB |
| a URL that doesn't exist | 3 ms | 12 ms | 24 ms | 154 ms | 320 ms | 404 | 61 KB |
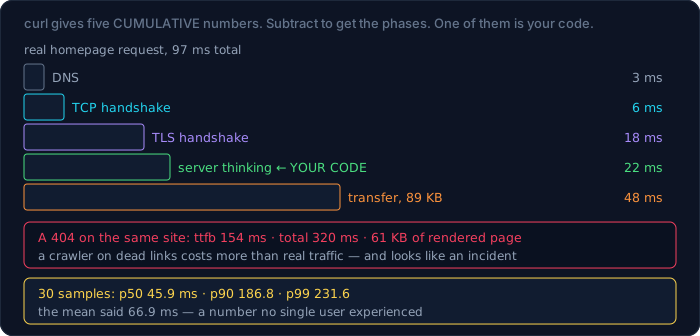
Read the first row by subtraction: DNS 3 ms, TCP handshake 6 ms, TLS handshake 18 ms, server thinking 22 ms, transfer 48 ms. Only one of those five numbers is your application. If "the site is slow" and time_appconnect is the number that moved, you have a TLS or network problem and reading application logs is time you don't have.
The last row is worth its own sentence: a 404 on this site costs 320 ms and 61 KB, because the framework renders a full styled page for it. A crawler hitting a hundred dead links costs more than a hundred real page views. That is not an outage, but it is the kind of thing that shows up as one on a graph.
One sample is not a measurement
Thirty requests to the same URL, sorted:
homepage    n=30   ttfb p50  45.9 ms   p90 186.8   p99 231.6   max 231.6
API 401     n=30   ttfb p50  46.5 ms   p90  81.3   p99 261.5   max 261.5
The median is 46 ms and the p90 is four times that. And the number every dashboard shows by default:
mean would have said: 66.9 ms
Sixty-seven milliseconds describes nobody. It's above the experience of half your users and far below the experience of the slowest tenth. During an incident the mean is actively harmful, because a tail that doubles barely moves it. Always ask for percentiles; if a tool only gives you an average, treat it as a smoke alarm, not a diagnosis.
The status code says which layer
Before you SSH anywhere, the response code narrows the search to one part of the stack:
| what you get | what it rules in |
|---|---|
| connection refused / timeout | nothing is listening — process or proxy is down |
| 502 / 503 | the proxy is up, the app behind it is not |
| 504 | the app is up and too slow to answer the proxy |
| 500 | the app ran your code and threw |
| 404 on a route that should need auth | the router was never mounted — stale or partial build |
| 401 | the route is mounted and working |
| 429 | rate limiting — see below, this is usually not an outage |
| 301/308 to https or to a login page | you're measuring the redirect, not the thing |
The 404-versus-401 row is the most useful trick here, and it comes from a real incident on this site. A partial build once shipped a dist/ that never mounted one router. The container reported healthy, the app served every other route, and one feature was silently dead. From the outside, unauthenticated:
curl -s -o /dev/null -w '%{http_code}\n' https://example.com/api/v1/gifs
401 means mounted and asking for auth. 404 means the route does not exist in the running image. That single distinction turns "a feature is broken, is it the frontend or the backend or the token?" into "the backend image is stale, redeploy". The deploy script now asserts it on every deploy, and fails the deploy on any 404.
The container layer: what an exit code means
When something restarted, the exit code is the first fact:
| how it ended | exit code |
|---|---|
| ran to completion | 0 |
the app called process.exit(3) |
3 |
| the app crashed on startup | 1 |
SIGTERM — docker stop, a rolling deploy |
143 |
SIGKILL — kill -9, or the OOM killer |
137 |
And here is the first thing the lab corrected. Everyone reads 137 as "out of memory". It means SIGKILL, and there are at least two ways to get one:
docker kill -s KILL …          → exit 137   OOMKilled=false
exceeded --memory 32m          → exit 137   OOMKilled=true
Same code, different cause. Docker records which:
docker inspect -f '{{.State.ExitCode}} OOM={{.State.OOMKilled}}' <container>
If OOMKilled is false and you spent the incident tuning memory limits, you tuned the wrong thing — something sent your container a SIGKILL, and the usual suspects are an orchestrator's stop timeout expiring or a human.
Why every deploy takes exactly ten seconds
This one I got wrong in a more interesting way. docker stop sends SIGTERM, waits, then SIGKILL. So a container running sleep 300 should die immediately on SIGTERM, right?
CMD ["sleep","300"]                  → exit 137, after 10.2 s
sh -c 'exec sleep 300'               → exit 137, after 10.2 s
sh -c 'trap …TERM; sleep 300'        → exit 137, after 10.2 s, trap never ran
sh -c 'trap …TERM; sleep 300 & wait' → exit   0, after  0.1 s, trap RAN
Three of four took the full timeout and were hard-killed. The cause is not Docker: a process running as PID 1 does not get default signal handlers. The kernel only delivers a signal to PID 1 if that process explicitly installed a handler for it. sleep doesn't handle SIGTERM, so as PID 1 it ignores it entirely.
The control experiment confirms the mechanism:
sleep as PID 1                → sleep is pid 1, exit 137, stopped after 10.2 s
docker run --init (tini pid 1) → sleep is pid 7, exit 143, stopped after  0.1 s
With an init process in front, sleep is an ordinary process with ordinary defaults, and it dies on SIGTERM in a tenth of a second.
The practical consequences are large and mostly invisible. Every deploy waits the full stop timeout per container. In-flight requests are severed rather than drained. Any cleanup your app does on shutdown never runs. And nothing anywhere logs a warning.
This site's backend gets it right, which is worth looking at because it's three separate decisions:
ENTRYPOINT ["/usr/bin/tini", "--", "/usr/local/bin/fix-uploads-perms.sh"]
CMD ["node", "dist/index.js"]
process.on('SIGTERM', () => shutdown('SIGTERM'));
process.on('SIGINT',  () => shutdown('SIGINT'));
tini as PID 1, the exec form of CMD so no shell sits between init and Node, and an application that actually installs a handler — which closes the HTTP server, disconnects Prisma, flushes Sentry and then exits. Remove any one of the three and graceful shutdown silently stops happening.
"Healthy" is not "working"
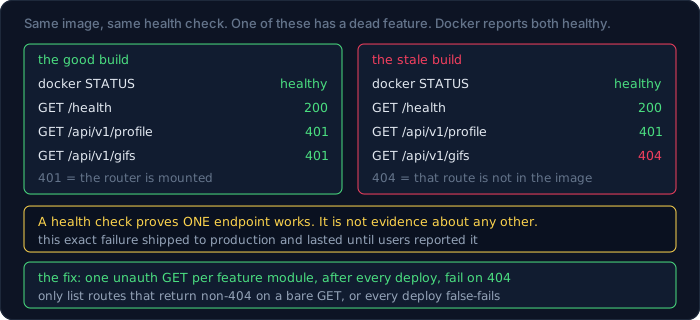
Two containers, identical except that one never mounts a router. Both have the same health check, hitting /health:
MOUNT_GIFS=0                       MOUNT_GIFS=1
  docker STATUS   : healthy          docker STATUS   : healthy
  GET /health     → 200              GET /health     → 200
  GET /api/v1/profile → 401          GET /api/v1/profile → 401
  GET /api/v1/gifs    → 404          GET /api/v1/gifs    → 401
Docker says healthy for both. One of them has a dead feature. A health check that hits one endpoint proves that one endpoint works, and people read it as proof the deployment succeeded — which is exactly how the real incident lasted until users reported it.
The fix is not a better health check; it's a different check at a different time. After every deploy, hit one param-less unauthenticated GET per feature module and fail the deploy on any 404:
for route in gifs messages/threads profile social/posts feed/posts …; do
    code=$(curl -s -o /dev/null -w '%{http_code}' "$BASE/$route")
    [ "$code" = 404 ] && smoke_failed=true
done
Two rules keep it useful: only list routes that return non-404 on a bare unauthenticated GET (a POST-only or param-required route 404s legitimately and would fail every deploy), and add one when you add a feature module.
docker stats, and the two columns that mislead
docker stats --no-stream --format \
  'table {{.Name}}\t{{.CPUPerc}}\t{{.MemUsage}}\t{{.MemPerc}}\t{{.NetIO}}'
NAME   CPU %   MEM USAGE / LIMIT    MEM %   NET I/O
st     0.37%   10.37MiB / 128MiB    8.10%   872B / 126B
Two warnings about that output. MEM USAGE includes the container's page cache, so a process that has merely read a lot of files looks like it is using memory it can give back instantly under pressure — a container sitting at 80% is not necessarily near its limit. And CPU % is normalised against all host cores, so a single-threaded Node process fully pegged shows about 100% on any machine, while 400% means four cores busy. Neither number is wrong; both are routinely read as something they aren't.
What docker stats is genuinely good for is the comparison: run it before and after a change, or across replicas. One replica at 8% memory and its twin at 95% is a real signal, and no absolute threshold would have told you that.
Restart loops
docker ps -a --format 'table {{.Names}}\t{{.Status}}'
docker inspect -f '{{.RestartCount}}' NAME
rl  Exited (1) 2 seconds ago
RestartCount: 5
A container with --restart on-failure:5 that has burned all five attempts stops silently — it is simply Exited, and nothing is going to try again. The Status column is the fastest thing on the screen during an incident: Up 3 minutes on a service you deployed two hours ago is the whole story, and you should read the uptimes of every container before you read a single log line.
docker events gives the same history with timestamps, which is what you want when the restart already happened:
docker events --since 30m --filter container=NAME \
  --format '{{.Time}} {{.Action}}'
"When did it start?" is a faster question than "what is broken?"
An incident has a start time, and almost always something changed just before it. On this machine, today, five deploys:
deploy 1   13:33:42 → 13:47:50   (14 min)
deploy 2   13:48:29 → 14:02:10   (14 min)
deploy 3   14:02:30 → 14:15:51   (13 min)
deploy 4   14:16:11 → 14:19:58   ( 4 min, warm cache)
deploy 5   18:23:10 → 18:34:40   (11 min)
Those timestamps came out of the deploy script's own log, because it prefixes every line with the time. That one habit — info() { echo "[$(date '+%H:%M:%S')] $*"; } — is what makes an afterwards possible. Without it you are reconstructing a timeline from memory during the one hour you are least able to.
The correlation to run first, before any deep diagnosis:
git log --format='%h %ad %s' --date=format:'%H:%M' -10
docker ps --format '{{.Names}}\t{{.Status}}\t{{.Image}}'
docker events --since 2h --filter event=start \
  --format '{{.Time}} {{.Actor.Attributes.name}}'
If the symptom started at 14:05 and a container started at 14:03, you are done narrowing: revert or roll forward and diagnose afterwards with the site up. If nothing changed on your side, the search moves outward — a dependency, a certificate that expired, a disk that crossed a threshold, a traffic pattern that arrived.
The trap in this step is confirmation bias in the other direction: not every incident is caused by the last deploy, and a rollback that doesn't help has cost you fifteen minutes and told you something useful. Note the time you started the rollback too.
Logs: four pipelines that answer four questions
You do not read logs during an incident. You aggregate them. Four awk one-liners over an access log, and — because a pipeline that quietly drops rows is worse than no pipeline — I ran these against a log generated with a known distribution so the output could be checked against the plan:
What is the shape of the traffic?
awk '{print $9}' access.log | sort | uniq -c | sort -rn
  7300 200
  1200 401
   900 429
   150 404
    37 500
Which endpoints produce the errors?
awk '$9 >= 400 {print $9, $7}' access.log | sort | uniq -c | sort -rn
  1200 401 /api/v1/profile
   900 429 /api/v1/feed/posts
   150 404 /api/v1/gifs
    37 500 /api/v1/social/posts
Two lines of that output are diagnoses on their own. 404 /api/v1/gifs is the stale-build signature from earlier. And 1,200 401s on /profile is normal — it's what an unauthenticated page load looks like. Knowing which of your error codes are load-bearing is half of reading a log.
Is the 429 one abusive client, or a limit that's too tight?
awk '$9 == 429 {print $1}' access.log | sort | uniq -c | sort -rn | head
awk '$9 == 429 {print $1}' access.log | sort -u | wc -l
    24 203.0.113.22
    23 203.0.113.4
    22 203.0.113.58
  → distinct IPs receiving 429: 60
Sixty different addresses, twenty-odd rejections each. That is not an attack; that is a rate limit set too low, and every one of those sixty is a real user seeing a broken page. The opposite shape — one IP with 900 — is a completely different problem with a completely different fix. Same status code, and the only thing that distinguishes them is the sort -u | wc -l.
This site had exactly that incident: a burst of 429s read as an outage, when the actual causes were a limit that was too tight and a rate-limit key derived from the wrong end of X-Forwarded-For. Which brings the general rule: 429 is a decision your code made, not a failure. It belongs in a different mental bucket from 500.
How slow is slow, from the log itself?
awk '$7=="/api/v1/feed/posts" && $9==200 {print $NF}' access.log | sort -n
  n=4000   p50 80 ms   p95 2400 ms   p99 2400 ms
  the mean would have said: 522 ms
The mean again, describing nobody: five per cent of requests to the busiest route take thirty times the median.
For container logs, three flags do almost everything:
docker logs --since 10m --timestamps <c>          # only the incident window
docker logs --since 10m <c> 2>&1 | grep -ciE 'error|fatal'   # worse than usual?
docker logs -f --tail 50 <c>                      # watch while you change it
--since is the one people skip, and it is the difference between reading the incident and reading the week.
The database, when everything else looks fine
Two queries answer most "the app is up but every request hangs" incidents. First, what is actually running:
select pid, state, now()-query_start as running_for,
       wait_event_type, wait_event, left(query,40) as query
from pg_stat_activity
where state <> 'idle' and pid <> pg_backend_pid()
order by query_start;
 pid | state  | running_for     | wait_event_type | wait_event | query
 91  | active | 00:00:02.007 | Timeout | PgSleep | select pg_sleep(30);
wait_event_type is the column that matters. Timeout or CPU means the query is doing work. Lock means it is waiting for another session — and then the second query tells you which one:
select pid, state, now()-xact_start as xact_age,
       wait_event_type||'/'||coalesce(wait_event,'-') as waiting_on,
       pg_blocking_pids(pid) as blocked_by, left(query,34) as query
from pg_stat_activity
where backend_type='client backend' and pid <> pg_backend_pid()
order by xact_start;
 pid | state  | xact_age        | waiting_on         | blocked_by | query
 105 | active | 00:00:05.17 | Timeout/PgSleep    | {}    | begin; update t …
 112 | active | 00:00:03.08 | Lock/transactionid | {105} | update t set v='B' …
pg_blocking_pids(112) = {105}. One row of output, one answer: session 112 is stuck behind session 105, and 105 is inside a transaction doing nothing useful. That is the classic idle in transaction failure — an application path that opens a transaction, makes a slow external call, and holds row locks the whole time. Every other request touching those rows queues behind it, the connection pool fills, and the symptom presented to you is "the whole site is slow" with no slow query anywhere.
Two more things worth having ready before you need them:
-- how close is the connection pool to full?
select count(*), state from pg_stat_activity group by state;
-- and, deliberately last, the one that ends it
select pg_cancel_backend(105);   -- polite: cancels the query
select pg_terminate_backend(105); -- rude: drops the connection
Cancel before terminate, and know that neither is a fix — they buy you the minutes to deploy the real one.
Node's own vital sign: event loop lag
For a Node service there is one number that says "is the runtime itself stuck", and almost nobody graphs it. Schedule a 20 ms timer repeatedly and measure how late it actually fires:
const t = process.hrtime.bigint();
setTimeout(() => {
  lag.push(Number(process.hrtime.bigint() - t) / 1e6 - 20);
}, 20);
Three states of the same process:
| p50 | p99 | max | |
|---|---|---|---|
| idle | 1.2 ms | 2.1 ms | 2.1 ms |
| bursts of 60 ms CPU work | 1.1 ms | 287 ms | 287 ms |
| one 1.2-second blocking call | 1.1 ms | 1181 ms | 1181 ms |
Look at the p50 column. It is 1.1 ms in all three rows. A median-based dashboard shows a perfectly healthy service while requests unlucky enough to land during the blocking call wait more than a second. Loop lag is the metric that distinguishes "the database is slow" from "the process is blocked" — CPU usage won't, because a blocked event loop and a busy one look identical from outside.
Anything above ~50 ms at p99 is worth investigating; anything above 500 ms means requests are timing out somewhere and you should look for synchronous work — a large JSON.parse, a sync crypto call, an accidental readFileSync on a hot path.
Disk: the failure that takes the database with it
Disk is the one resource whose exhaustion converts a small problem into a total outage, because PostgreSQL stops accepting writes and everything downstream fails at once. This site has had exactly that.
Read it in this order:
df -h /                              # is it actually full?
df -i /                              # ...or is it inodes, which df -h won't show
docker system df                     # on a container host, usually the answer
du -sh /path/* | sort -rh | head     # only after the first three
docker system df on a machine that had never been pruned:
TYPE          TOTAL  ACTIVE  SIZE      RECLAIMABLE
Images        37     7       31.7 GB   3.783 GB (11%)
Containers    15     15      3.424 MB  0 B
Local Volumes 34     15      4.589 GB  1.449 GB (31%)
Build Cache   306    0       26.39 GB  21.38 GB
Twenty-six gigabytes of build cache, none of it active, twenty-one reclaimable. A du of the project directory would never have found it — it isn't in the project directory. This is why docker system df belongs before du in the order, and why a deploy script that builds images should prune on every run.
The two commands, in increasing order of how much you'll regret them:
docker builder prune          # build cache only — almost always safe
docker system prune -a        # every unused image — next deploy re-downloads
And df -i: a filesystem can run out of inodes while df -h still shows free space, which presents as "no space left on device" on a disk that looks half empty. Caches of many tiny files are the usual cause, and node_modules is a cache of many tiny files.
The first ten minutes
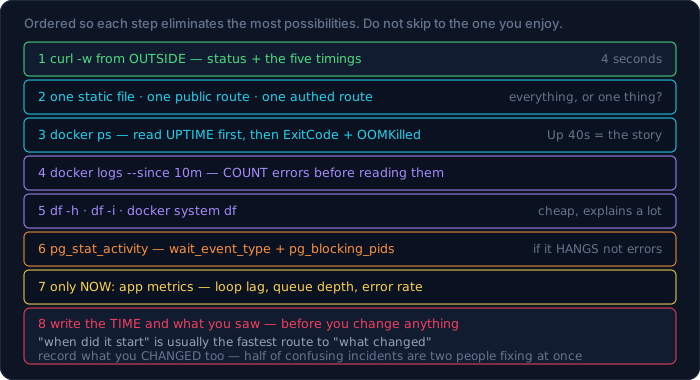
The order is chosen so each step eliminates the most possibilities:
curl -wfrom outside. Status code and the five timings. This alone separates DNS/TLS/network/app/slow-vs-down, and it takes four seconds.- Is it everything or one thing? One static asset, one public route, one authenticated route. If static is fine and the API 502s, you have narrowed it to the app in one command.
docker ps. Uptime column first — a container that restarted 40 seconds ago is the story. Then exit code andOOMKilledfor anything that restarted.docker logs --since 10mon the suspect container. Only the window. Grep forerror|fataland count before reading.df -handdocker system df. Cheap, and disk explains a whole class of unrelated-looking symptoms.pg_stat_activityif requests hang rather than error.wait_event_typeandpg_blocking_pidsin one query.- Only now, application metrics. Loop lag, queue depth, error rate by endpoint.
- Write down the time and what you saw before you change anything. You will need it for the write-up, and more importantly, "when did it start" is often the fastest route to "what changed".
The step people skip is 8, and it's the one that turns an incident into a fix instead of a mystery.
The hardest category: "it works when I try it"
Look again at the homepage sample: p50 45.9 ms, p90 186.8 ms. One request in ten is four times slower than the median — and a single curl has a ninety per cent chance of landing in the fast group and telling you everything is fine. That is the entire mechanism behind "I can't reproduce it", and it means the reproduction attempt has to be shaped differently:
Take thirty samples, not one. The loop from the top of this guide costs four seconds and turns "seems fine" into a distribution. If p50 is healthy and p99 is not, the users complaining are real and you are looking at a tail, not a ghost.
Ask what the slow ones have in common rather than whether they exist. Same endpoint? Same user? Same minute of the hour — which would point at a cron job, a cache expiry, or a backup window? The log pipelines above answer this: filter to the slow requests first, then aggregate by IP, path and timestamp and see which column stops being uniform.
Beware "it fixed itself". A symptom that disappears without a change usually means something else changed — a queue drained, a lock released, a deploy completed, a rate-limit window rolled over. Nothing self-heals; something else moved. Writing down the time it stopped is as useful as the time it started, because the gap between them often matches a configured interval exactly.
And the honest limit of everything in this guide: intermittent problems are where ad-hoc commands stop being enough. If you are running the thirty-sample loop by hand more than twice a week, that is the signal to put percentiles on a dashboard and stop rediscovering them under pressure.
A worked example: two symptoms, one cause, one red herring
This is the incident that produced half the techniques above, reconstructed from this site's own incident log.
The report. Two complaints arrive together. The GIF picker in the messenger is dead. And "my chats have disappeared". Both survive a logout and a fresh login, which is the detail that makes it look like one big backend failure.
What the browser said, which is why the first hour went nowhere: a network tab full of red, a feature that had worked yesterday, and no error anywhere that named a cause. Browser devtools are excellent for the request you are looking at and terrible for the question "which layer is broken", because everything in them is filtered through your session, your cache and your extensions.
What one command said instead. Unauthenticated, from outside, no session involved:
GET /api/v1/gifs             → 404
GET /api/v1/messages/threads → 401
Two routes in the same app, two different answers. 401 means the router is mounted and demanding auth — that route is fine. 404 means the running image has no such route at all. Not a permissions problem, not a token problem, not a config problem: the container is running an old build. The deploy that was supposed to add that router had shipped a stale dist/.
That is the whole diagnosis, and it took one command that involved no login, no browser and no guessing. A full rebuild and deploy fixed it.
And the red herring. The "disappearing chats" were never gone and had nothing to do with the stale build. They had been hidden by a per-viewer soft delete — a delete-for-me flag — and the query that listed threads filtered them out. Two reports arriving together had felt like one cause, and treating them as one cause was the reason the first hour was spent looking for something that could break both.
Three things to take from it:
Symptoms arriving together are not evidence of a common cause. They are evidence that a user noticed two things at once. Diagnose them separately until something forces them together.
Test from outside the session. Anything that goes through your login, your cookie or your browser adds three ways for the test to lie. curl with no credentials is the cleanest instrument you own.
A negative result is progress. 401 on the messages route eliminated an entire branch of the search — the app was up, the router was mounted, auth was working. Half of a fast diagnosis is ruling things out cheaply.
The fix outlived the incident, which is the part that matters: the deploy script now runs that exact unauthenticated check across every feature module and fails the deploy on any 404. The same class of failure cannot reach production silently again.
A second one, shorter, for the shape
Sessions started dying after exactly 24 hours. Every authenticated call returned 401 while the cookie was clearly still present in the browser — which reads as "the cookie is broken" and sends you into cookie-domain and SameSite territory for an afternoon.
The number is the clue. Exactly 24 hours is not a bug's timing; it's a configuration value. The JWT was issued with a 24-hour expiry while the cookie carrying it lived for seven days, so for six days the browser dutifully sent a token the server had already stopped accepting. Nothing was broken; two numbers disagreed.
When a symptom has a round period — exactly 24 hours, exactly 60 seconds, exactly 5 minutes — stop debugging behaviour and go read configuration. Timeouts, TTLs, expiries and cron intervals are where round numbers live.
Write it down while it's happening
Three lines, in a scratch file, as you go:
14:05  502 on /feed. curl outside: 502, ttfb 3ms → proxy up, app not
14:06  docker ps: backend Up 40 seconds, RestartCount 12 → it is crash-looping
14:07  logs --since 5m: "connect ECONNREFUSED 10.0.0.4:5432" → it's the database
That is not documentation; it is working memory you will not otherwise have. Three specific reasons it pays for itself within the hour:
You will be asked "when did it start" by someone who can help. A timestamp you wrote at 14:05 is worth more than a recollection at 15:30.
It stops you re-checking things. Under pressure people run docker ps four times in ten minutes because they can't remember what it said. The note is the cache.
It is the post-mortem. The write-up afterwards is nearly free if the timeline already exists, and nearly impossible if it doesn't — and the write-up is the only part of an incident that prevents the next one.
One discipline to go with it: record what you changed, not just what you saw. "Restarted backend at 14:09" belongs in the same file, because half of all confusing incidents are two people fixing it at once, and the other half are a fix that worked being credited to the wrong action.
Four signals worth trusting, four that mislead
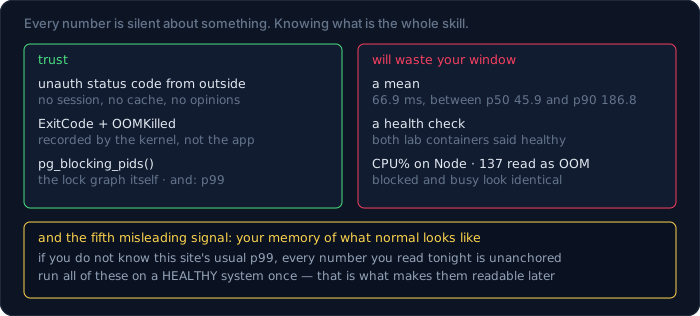
Trust these. An unauthenticated status code from outside — it has no opinions and no cache. A container's exit code and OOMKilled flag — recorded by the kernel, not by your app. pg_blocking_pids — it is the lock graph, not an inference from it. And a p99, because it describes the experience that generates the complaints.
These will waste your window. A mean — measured above at 66.9 ms while the p50 was 45.9 and the p90 186.8; it is a number no user experienced. A health check — both containers in the lab reported healthy and one had a dead feature. CPU usage on a Node process — a blocked event loop and a busy one look the same, which is why loop lag exists. And exit 137 read as "OOM" — it means SIGKILL, and OOMKilled=false in one of the two lab cases that produced it.
There's a fifth on the misleading list that deserves its own line: your own memory of what normal looks like. If you don't know the site's usual p99, or that 1,200 401s an hour is what logged-out traffic looks like here, then every number you read during an incident is unanchored. Ten minutes spent running these commands on a healthy system is worth more than any amount of reading about them.
What I got wrong measuring this
Six, and the first two are things I have said out loud during real incidents.
- "It exited 137, so it was OOM-killed." 137 means SIGKILL. In the lab,
docker kill -s KILLproduced 137 withOOMKilled=false, and a genuine memory-limit breach produced 137 withOOMKilled=true. Same code, two causes, and onlydocker inspectdistinguishes them. Tuning memory because you saw 137 is a coin flip. - "
docker stopsends SIGTERM, so the app shuts down gracefully." Three of four container forms took the full 10-second timeout and were hard-killed, because PID 1 does not get default signal handlers — an unhandled signal is simply ignored.docker run --initput tini at PID 1 and the same command stopped in 0.1 s with exit 143. Every deploy on a container without an init or a signal handler is a hard kill dressed up as a graceful one. - "The container is healthy, so the deploy worked." Two containers, same health check, both
healthy; one served 404 on a route that should have been 401. A health check proves one endpoint works. It was never evidence about the rest. - "The average response time is a reasonable summary." Thirty samples: p50 45.9 ms, p90 186.8 ms, mean 66.9 ms. The mean sat between them describing no one, and the same shape appeared in the log analysis (p50 80 ms, p95 2,400 ms, mean 522 ms) and in event loop lag (p50 unchanged at 1.1 ms while p99 went to 1,181 ms). Three independent measurements, one conclusion: during an incident, a mean is a way of not knowing.
- "
df -handduwill tell you what filled the disk." The 26 GB was Docker build cache — outside every project directory, invisible toduon the code, and reported only bydocker system df. On a container host that command belongs beforedu, not after. - "A wave of 429s means someone is attacking you." In the log, 900 rejections spread over 60 distinct IPs, about 24 each — a limit set too low, hitting ordinary users. One IP with 900 would be the other diagnosis entirely, and the only thing separating them is
sort -u | wc -l.
The pattern across all six: each is a case where one number was being asked to answer a question it cannot answer. 137 can't tell you why, a health check can't tell you about routes it doesn't call, a mean can't tell you about a tail, and du can't see outside the tree you pointed it at. The discipline isn't collecting more metrics — it's knowing what each one is silent about.
Cheat sheet
# from outside — always first
curl -s -o /dev/null -w '%{http_code} %{time_starttransfer} %{time_total}\n' URL
curl -s -o /dev/null -w '%{http_code}\n' URL/api/v1/<r>   # 401=mounted 404=stale

# containers
docker ps --format 'table {{.Names}}\t{{.Status}}\t{{.Image}}'
docker inspect -f '{{.State.ExitCode}} OOM={{.State.OOMKilled}}' NAME
docker logs --since 10m --timestamps NAME 2>&1 | grep -ciE 'error|fatal'
docker stats --no-stream

# disk, in this order
df -h / ; df -i / ; docker system df ; du -sh /srv/* | sort -rh | head

# postgres
select pid,state,now()-query_start,wait_event_type,pg_blocking_pids(pid)
  from pg_stat_activity where state <> 'idle' order by query_start;

# logs
awk '{print $9}' access.log | sort | uniq -c | sort -rn
awk '$9>=400 {print $9,$7}' access.log | sort | uniq -c | sort -rn | head
awk '$9==429 {print $1}' access.log | sort -u | wc -l   # 1 client, or all?
| Symptom | Look at first |
|---|---|
| "the site is down" | curl -w from outside — status plus the five timings |
| slow, but only sometimes | percentiles, never the mean; then event loop lag |
| one feature broken, rest fine | unauthenticated curl on its route — 404 means stale build |
| container keeps restarting | exit code, then OOMKilled, then logs --since |
| every deploy takes 10 s per container | no init and no SIGTERM handler — PID 1 ignores it |
| requests hang, no errors | pg_stat_activity: wait_event_type and pg_blocking_pids |
| CPU low, everything slow | event loop lag at p99, not CPU |
| "no space left" on a half-empty disk | df -i — inodes, not bytes |
disk full and du finds nothing |
docker system df — build cache lives outside your tree |
| flood of 429 | count distinct IPs: one client, or a limit that's too tight |
| database "down" right after disk filled | it isn't down; it stopped accepting writes. Free space first |
Where to go next
- Shell Scripting for People Who Deploy Things — the deploy script that runs these checks for you, including why a health-check loop written with
&&can fail the deploy at the exact moment everything is healthy. - How to Use the Command Line in Linux and macOS — pipes, exit codes and text processing, which is what every command above is made of.
- Practical exam — the graded version: you get the symptoms and the shell, and you find it.
Bài liên quan
Chuyên sâu
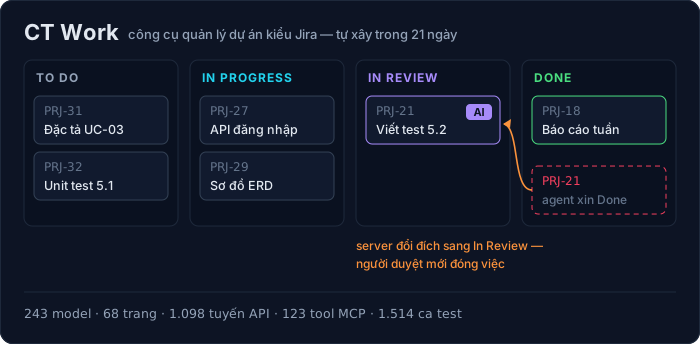
Tôi tự xây một công cụ kiểu Jira: CT Work sau 21 ngày, 113 commit và mười lỗi đã trả giá
Nhật ký kỹ thuật của CT Work, công cụ quản lý dự án và đồ án sinh viên FPT dùng thật: kiến trúc và mã thật, AI agent qua MCP, số đo bằng lệnh (243 model, 68 trang, 1.514 ca test), mười lỗi đã sửa, mẹo dùng — và khi nào không nên dùng.
Chuyên sâu
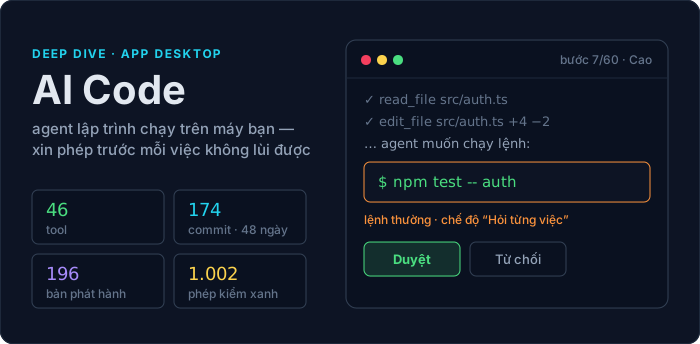
AI Code: agent lập trình trong app desktop — cách dựng, lỗi đã gặp, và cách dùng cho đáng tiền
Agent lập trình trong app desktop CuongThai: kiến trúc và mã thật, 174 commit trong 48 ngày, 9 lỗi đã gặp và cách sửa, vì sao giá một lượt không nói lên giá trong vòng lặp gọi tool, mẹo chọn model — và khi nào KHÔNG nên dùng.
Chuyên sâu
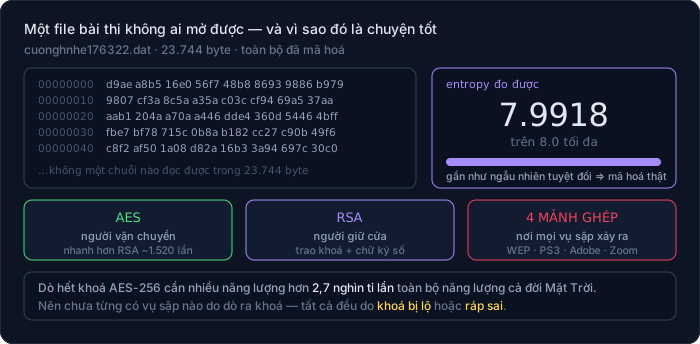
Mã hoá cho lập trình viên: AES, RSA, chữ ký số — và vì sao đừng bao giờ tự viết thuật toán
Bắt đầu từ một file bài thi .dat mở ra không được: entropy 7,99 nói lên điều gì, vì sao dò khoá AES là bất khả thi về mặt VẬT LÝ chứ không phải "rất khó", AES khác RSA ra sao (đo thật: chênh ~1.520 lần). Kèm thí nghiệm ECB làm lộ nguyên hình ổ khoá và sáu vụ sập kinh điển.
Chuyên sâu
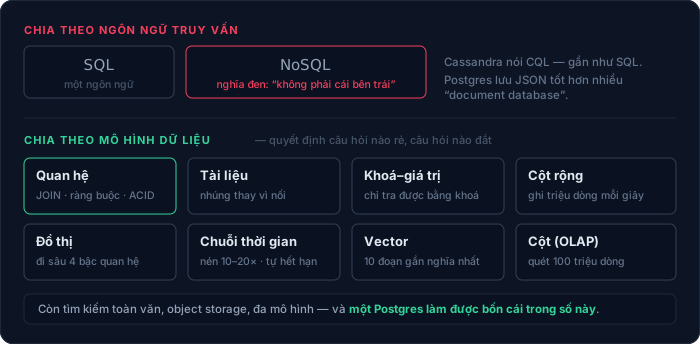
Có bao nhiêu loại cơ sở dữ liệu — và chọn cái nào cho việc gì
"SQL hay NoSQL" là phép chia sai: một vế là ngôn ngữ, vế kia nghĩa đen là "không phải cái kia". Bài này chia lại theo mô hình dữ liệu (11 loại), theo tải công việc và theo cách triển khai; giải thích ACID, mức cô lập, write skew, CAP bị hiểu sai ở đâu, B-tree so với LSM-tree; kèm cây quyết định, mười sai lầm hay gặp, và hồ sơ thật của chính trang này — 248 bảng trên một Postgres, một VPS 6GB.
Bình luận